
Listen to this blog
In my 12-plus years as an AI leader, I have helped countless businesses evolve from traditional spreadsheets to AI-driven decision-making. Over the decades, I have focused on transforming raw data into actionable business insights through scalable enterprise systems, cloud-native platforms, and responsible governance.
Last week, did you make a business decision using a spreadsheet, a report, or maybe a gut feeling because the data just was not clear enough? If you are like most business professionals, the honest answer is probably all three. That is completely normal and that is where most organizations are right now.
But the tools for making those choices are transforming fast. This is not an “Excel versus AI” competition. Excel is on virtually every laptop and is not going anywhere. What we are really talking about is a layered system: Excel plus BI, plus AI, plus good governance, all working together.
The Hidden Cost of Spreadsheet Reliance
Let me start with a number that tends to get people’s attention: the average business loses $9.7 million per year not from a cyber attack or a failed product launch, but from poor data quality. This is an IBM figure validated across multiple industries.
Furthermore, peer-reviewed audit research by Professor Raymond Panko shows that 84% to 91% of operational business spreadsheets contain errors. I am talking about significant logic errors – the kind that quietly give you the wrong answer while looking completely correct on your screen.
The Cost of a Single Line Error
To show you how severe this can get, look at what happened in 2018 to a UK alcohol retailer called Conviviality. Someone entered a single incorrect line into a financial forecast spreadsheet, which overstated profits by about 5 million pounds. When the error surfaced, their shares dropped 60% in a single trading session. Within three weeks, investors lost 500 million pounds in market value, and the company went into administration. That was just one line, one error, in one spreadsheet.
Conversely, companies deploying AI analytics are seeing massive upsides, including better demand forecasting, higher fraud detection rates, and less unplanned operational downtime. Data is money and decisions. While Excel is a remarkable and universally understood tool since 1985, version history cannot tell you if a formula was built wrong from day one. It also struggles to process millions of rows of real-time data without freezing, lacks robust approval workflows, and leads to fragmented versions of organizational truth. Think of Excel as the Swiss Army knife of business: incredibly useful, but you would not use it to build an entire house.
Scaling the Analytics Maturity Staircase
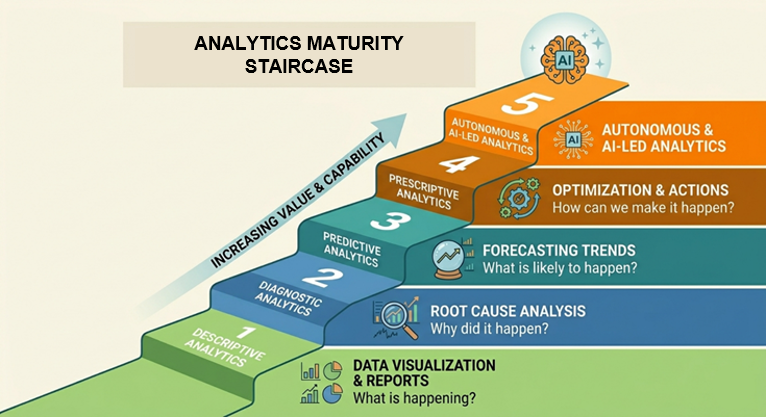
To understand how the industry evolved beyond these limitations, I use a framework called the Analytics Maturity Staircase, which features five distinct levels:
- Level 1: Descriptive Analytics: This answers what happened. It includes your typical monthly sales reports and backward-looking revenue dashboards.
- Level 2: Diagnostic Analytics: This explains why it happened. It requires drilling down into patterns to see why sales dropped or why customer churn spiked.
- Level 3: Predictive Analytics: This forecasts what will happen next based on current trends, utilizing churn prediction and demand forecasting models.
- Level 4: Prescriptive Analytics: This provides recommendations on what we should do about it, such as advising you to move 20% of your stock to a different warehouse for better supply chain management.
- Level 5: Autonomous & AI-Led Analytics: This allows the system to decide and execute actions within pre-approved boundaries, learning from outcomes to get smarter over time.
To help you remember this flow, imagine going to a doctor with a high fever. First, you give a description of your symptoms (what happened). The doctor then diagnoses you (why it happened). Next, they predict how the fever will behave over the coming days (what will happen). Finally, before you leave the room, they hand you a prescription (what you should do).
Read more: Popular AI-assisted Data Analytics Tools of 2026
Historically, moving up to predictive or prescriptive layers required an entire department of data scientists. Today, modern AI tools have collapsed that barrier, making advanced analytics accessible to everyone.
Traditional Analytics vs. AI-Powered Analytics
The shift from traditional methods to AI-powered environments introduces a fundamentally new way of interacting with data.
| Feature | Traditional Analytics | AI-Powered Analytics |
|---|---|---|
| Insight Generation | Upfront reporting where analysts decide what the dashboard shows. | Proactively surfaces insights and flags anomalies automatically. |
| Inquiry Style | Requires you to ask a specific question. | Suggests critical questions you did not even think to ask. |
| Temporal Focus | Backward-looking (what happened). | Forward-looking (what will happen next). |
| Technical Barrier | Requires technical knowledge of SQL, DAX, or complex formulas. | Operates entirely in plain, simple English. |
| Error Handling | Catches errors after the fact in the next reporting cycle. | Detects anomalies and spikes in real time. |
Think of traditional analytics like a standard calculator: you give it inputs, and it gives you outputs. AI analytics is like a GPS system; it maps your route, warns you of traffic ahead, recalculates when you take a wrong turn, and learns your patterns over time. Both are useful, but only the GPS is intelligent.
Real Businesses, Real Results
This structural shift is already happening around us. The AI analytics market is currently valued at $12.8 billion and is projected to reach $89.6 billion by 2034, growing at a compounding annual rate of nearly 22%. According to a McKinsey 2025 global survey, 88% of organizations now use AI in at least one business function.
Let us look at how different companies are deploying these techniques successfully:
- Swiggy: Facing a 10-minute refresh lag on their dashboards that disrupted their ultra-fast delivery promises and fraud detection, Swiggy implemented AI solutions and chatbots for real-time delivery and inventory visibility.
- General Mills: Managing 4,000 suppliers, 200 global plants, and 50 million annual planning decisions made for slow operations. They plugged in an AI-augmented supply chain platform built on Palantir. Today, human planners accept more than 70% of the AI’s real-time recommendations.
- Global Retailer: To combat constant stockouts on fast-moving items and excess inventory on slow ones, this retailer used the C3AI platform to establish a real-time tracking system for supplier lead times.
- Amazon Rufus: Amazon integrated a personalized generative AI shopping assistant directly into their mobile app, functioning like a helpful in-store clerk to guide customer purchases.
- Vallarta Supermarkets: Proving that AI is not just for multinational giants, this regional grocery chain adopted accessible AI tools to optimize their operations and improve efficiency.
Mastering the Toolkit and Techniques
To replicate these results, you have to adopt specific techniques rather than just buying the tools. First, you must ask better, action-oriented questions. Instead of asking “What were our sales last month?”, ask “Which regions declined despite increased marketing spend, and what three actions should we prioritize next month to improve?”
Second, map out your relationships using a KPI tree. If you feed an AI a clear breakdown showing that profit depends on revenue and costs, and that revenue is driven by customer count, order value, and purchase frequency, the system can pinpoint precisely what is impacting your business.
Third, recognize that data quality is non-negotiable. A Gartner study highlights that 62% of organizations cite data governance as their top blocker for AI deployment. The best chef in the world cannot make a great meal from rotten ingredients; your data is the ingredient, and AI is the chef.
Finally, implement the Analytics-to-Action loop while keeping a Human-in-the-Loop (HITL). The AI detects patterns, explains trends, and recommends choices, but a human must validate the final decision. Autopilot handles the routine altitude adjustments, but the pilot always takes the controls for landings and emergencies.
A 90-Day Roadmap for Your Team
If you are ready to transition your team into smarter, AI-driven analytics, you can implement this practical, 90-day execution strategy starting next week:
Days 1–30: Identify the Quick Wins
Focus on low-risk operational bottlenecks. Introduce automated tools like Microsoft Copilot within Excel to let non-technical team members generate complex formulas, run basic natural language data queries, or try out Python-powered data clustering and heat maps.
Days 31–60: Build Your Data Foundation
Take the lessons learned from your initial proof of concept and focus heavily on data quality. Clean your historical datasets, establish clear data governance guardrails, and build a centralized data platform to act as your single source of truth.
Days 61–90: Deploy AI-Powered Analytics
Layer your advanced analytics tools, such as Power BI Copilot or Tableau Pulse, on top of your clean data foundation. Allow the system to actively scan your data, flag unusual outliers, and deliver automated daily summaries directly into your email or Slack feeds so your team can shift from reactive reporting to proactive action.
You might like this: Degree or Certificate: Which course you should pursue in Data Science
Charting Your Path Forward
As you move through this transformation, you must recognize that the AI era is not about job replacement; it is about upskilling to close the organizational skill gap. Embracing these intelligent layers ensures your business transitions smoothly from backward-looking metrics to forward-looking strategy.
To build a comprehensive foundation in managing these digital transformations, integrating data workflows, and leading technological shifts within an organization, exploring advanced educational programs can be a powerful next step. The Online MSc in Data Science program from MAHE provides specialized tracks in data analytics, digital marketing, and strategic technology management designed to equip professionals with the exact leadership frameworks needed to navigate the modern, AI-driven corporate landscape.
Prepare for your next career milestone with us