Blogs

How to Read Financial Statements Without a Finance Background

Listen to this blog

Finance can seem intimidating when you don’t come from a finance background. Numbers, ratios, balance sheets, profit and loss statements, cash flows – it can quickly feel like too much. But here’s the thing: you don’t need to be a finance expert to understand what a company’s numbers are telling you.
I often explain finance through a simple idea. Financial data becomes useful only when we can measure it, process it, and communicate what it means. Accounting forms the link between business activities and financial decisions. Once you understand that link, financial statements become much easier to read. So, where should you begin?
Start with the basics of financial accounting
The first thing you need to understand is why financial information matters. A company needs to know how much it earns, what it spends, what it owns, what it owes, and how much cash it has. This information helps management make decisions.
Should the company open a new unit? Should it buy new machinery? Should it invest in land? Should it raise capital through an IPO? These aren’t decisions made in isolation. Management uses financial data to understand where the business stands and where it needs to focus. There are three basic financial activities to keep in mind:
- Operating activities: These are the regular activities of a business, such as buying and selling, paying taxes, and managing day-to-day operations.
- Investing activities: These involve investing funds into assets. Fixed assets can include land, buildings, and furniture, while current assets can include stock and bills receivable.
- Financing activities: These involve raising capital, whether through additional capital, banks, or investors.
Once you understand these three activities, the financial statements start making more sense.
Read more: What Is Business Economics? Types, Scope & Importance
Know the four financial statements
When I introduce financial statements to beginners, I focus on four statements.
1. Income statement
The income statement, also called the profit and loss account, shows the company’s revenues and expenses. At its simplest: Net income = Revenue – Expenses You can prepare an income statement for a month, quarter, or year. It helps you understand how much income the company generated and what it spent to generate that income.
2. Statement of retained earnings
Retained earnings show what remains with the company after accounting for net income and dividends. The basic relationship is: Opening balance + Net income – Dividend = Retained earnings. This figure is then reflected in the balance sheet.
3. Balance sheet
The balance sheet gives you the status of a company’s assets and liabilities during a financial year. An asset is something the company owns, while a liability is something the company owes. The fundamental accounting equation is: Assets = Liabilities + Stockholders’ Equity. This equation connects the different parts of the financial statements. The balance sheet also reflects information flowing from the income statement, retained earnings, and cash position.
4. Cash flow statement
The cash flow statement shows how cash moves through operating, investing, and financing activities. This is important because profit and cash aren’t the same thing. You need to understand where cash is coming from and where it’s being used.
Also read: Corporate Accounting: Definition, Importance, Process & Careers
Don’t stop at the numbers. Use ratios.
Financial statements give you data. Ratios help you quantify that data. I like to think of financial ratios as a yardstick for measuring a company’s performance. They can give you a clearer picture of liquidity, leverage, profitability, valuation, and operational efficiency. Here are some of the key ratios to understand:
- Current ratio: Current assets divided by current liabilities. It helps assess liquidity.
- Quick ratio: Current assets minus inventory, divided by current liabilities. It focuses on assets that can be converted into cash more quickly.
- Debt-to-equity ratio: Helps you understand how much a company relies on borrowed money compared with equity.
- Return on assets: Helps assess how effectively the company’s assets generate income.
- Return on equity: Shows the return generated on shareholders’ equity.
- Earnings per share: Helps you understand earnings attributable to each share.
- Inventory turnover: Shows how quickly inventory moves and gets converted into cash.
- Receivables turnover: Helps you understand how quickly a company collects money from its debtors.
Each ratio answers a different question. Is the company liquid? Is it relying too heavily on debt? Is it generating enough profit? Are its assets producing income? Is inventory moving quickly? That’s why I don’t recommend looking at just one ratio.
Read ratios together, not in isolation
One of the easiest ways to understand financial analysis is to compare companies. Consider the example of Amazon and Flipkart. Based on figures, Amazon had a higher gross profit margin and net profit margin. It also had a higher return on equity and stronger interest coverage. Flipkart, however, showed stronger liquidity and lower leverage. So which company was better?
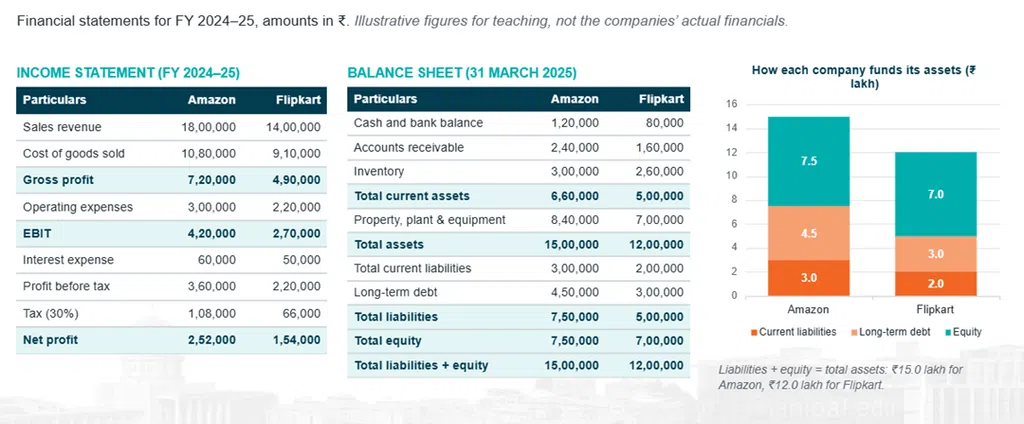
Based on those figures, Amazon was in a better position overall. But that doesn’t mean Flipkart was performing poorly. Both companies were financially healthy in the example, but they had different strengths. This is an important lesson.
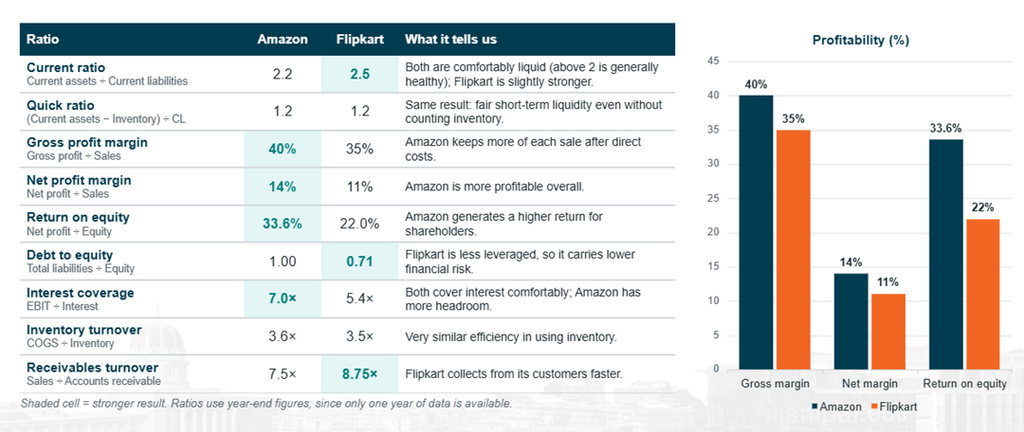
A company can have higher returns while also carrying higher financial risk. Another company may be more conservative, with stronger liquidity and lower leverage. That’s why ratios need context. A positive cash flow doesn’t tell the whole story. I was also asked an important question about companies that show increasing revenue and positive cash flow while their share prices fall.
My answer was simple: don’t stop at the positive cash flow. You need to look at the company’s fundamental and technical performance. Compare its performance with other companies and the wider industry. Look at where its revenues come from, what its business goals are, and how it performs against its key responsibility areas.
A company may show positive cash flow but still have weaknesses. It could be paying significant interest on debt. Its current assets may not be performing well. Its inventory may be ageing. Its direct and indirect expenses may need closer attention. So, don’t settle for the rosy picture. Go deeper.
Another interesting read: All You Need to Know About MSc in Financial Economics
Be alert to what the statements don’t show clearly
Another area I always ask learners to watch is window dressing. A company may sometimes present its financial position in a way that makes its performance appear more positive. Issues such as borrowings, interest payments, ageing stock, return on assets, or return on equity may not always give you the complete picture if you don’t examine the numbers carefully. This is why financial statement analysis isn’t simply about reading figures. You need to interpret them.
Turn financial data into better decisions
For me, that’s the real purpose of financial analysis. First, read the income statement, balance sheet, and cash flow statement. Then quantify the information using financial ratios. Finally, interpret what those ratios are telling you.The ratios I would pay particular attention to include the current ratio, liquid ratio, debt-to-equity ratio, return on assets, return on equity, and earnings per share. You don’t have to understand everything at once.
Start with the basics. Understand what the company earns, spends, owns, owes, and how its cash moves. Then use ratios to ask better questions. Because financial statements aren’t just numbers on a page. They help you understand the financial health of a company and support better decisions.
For learners pursuing an MBA through Online Manipal, this way of looking at financial statements can be especially useful. Whether you’re working in finance, marketing, operations, technology, or another business function, understanding the numbers behind a business can help you look beyond your immediate role and make more informed business decisions.
You don’t need to become a finance expert overnight. Start by learning how to read the numbers. Then learn what they mean. – Gowtham Shankar
Prepare for your next career milestone with us

Information related to companies and external organizations is based on secondary research or the opinion of individual authors and must not be interpreted as the official information shared by the concerned organization.
Additionally, information like fee, eligibility, scholarships, finance options etc. on offerings and programs listed on Online Manipal may change as per the discretion of respective universities so please refer to the respective program page for latest information. Any information provided in blogs is not binding and cannot be taken as final.