Listen to this blog
Business analytics is a field of study that uses quantitative techniques to analyze data and make decisions about the potential growth of the business.
Business analytics uses data from multiple sources to predict future trends and optimize operations. It can include internal data from systems such as financial statements or human resources records and external sources such as industry surveys or online sales data. Analysts may also use their expertise in marketing or finance to help interpret these numbers.
Check out our detailed blog to know the advantages of business analytics.
Key concepts in business analytics
Business analytics is a field that aims to use data and computational techniques to help businesses make better decisions. The field encompasses various topics, from analyzing large datasets and developing predictive models to providing insights into consumer behavior and market trends.
In this section, we’ll discuss some key business analytics concepts.
- Business Statistics
Business statistics is the study of numbers businesses use to make decisions. These numbers are typically collected to find patterns, trends, and relationships among them. Statistics is one of the most important tools a business can use to improve its operations and make better decisions.
There are several types of business statistics:
- Financial statements (including cash flow statements and balance sheets)
- Demographic information (age distribution and gender-wise breakdown of customers)
- Consumer purchase behaviors (how much time people spend on different websites when they are searching for something)
There are three broad areas of business statistics:
- Descriptive statistics include summarizing data in various ways.
- Inferential statistics use statistical tests and business analytics techniques to infer conclusions about unknown variables.
- Experimental statistical methods use randomization procedures or experiments designed to answer questions about likelihoods or probabilities.
Want to know the different career prospects in business analytics? Check out our detailed guide on business analytics careers for more information.
- Business Econometrics
Business econometrics is a field of economics that uses statistical techniques to study how companies make decisions. It’s often used to develop models that can be used to predict how a company will perform in the future or to help companies make better decisions about their operations.
Business econometrics can be applied to any business, from large multinational corporations to small start-ups with just one employee. It has applications in areas like marketing, pricing, and financial management.
- Time Series Analysis
Time series analysis is a technique that uses past data to predict future events. It’s used in business analytics to study trends, patterns, and changes over time.
Time series analysis is used as a way to understand how markets work and make predictions about what will happen next. For example, it can be used by financial analysts to forecast the value of stocks based on their current price and other factors such as demand and supply.
Want to know the latest trends in business analytics? Check out our detailed blog on business analytics trends for more information.
- Business Intelligence
Business intelligence means collecting, analyzing, and interpreting data for better business decisions. It involves using analytics as a business intelligence tool to solve business problems.
Business intelligence aims to provide an overview of the data and its relationships so that information can be used in marketing, operations, sales, or customer service. It involves gathering, storing, and analyzing data to create reports that describe key performance indicators (KPIs) for managers.
- Predictive Analytics
Predictive analytics is a field of data science that uses statistical models to make predictions. It can predict the performance of a company’s products or services or customer behavior.
Predictive analysis techniques aim to identify patterns in large sets of data, which can then be used to make predictions about future events or outcomes. Predictive analytics has many applications in business and finance, such as predicting sales trends or identifying fraudulent banking transactions.
- Data Visualization
Data visualization means using data to visualize information so people can understand it. This can be done through graphs, charts, maps, and other visual data displays. Data visualization in business helps you see patterns in your data and make connections between different pieces of information.
Some common techniques used when creating visual displays include the following:
- Bar charts
- Line graphs
- Pie charts
- Scatter plots
- Quantile regression
- Frequency distributions
- Pictogram
- Business Analytics Dashboard
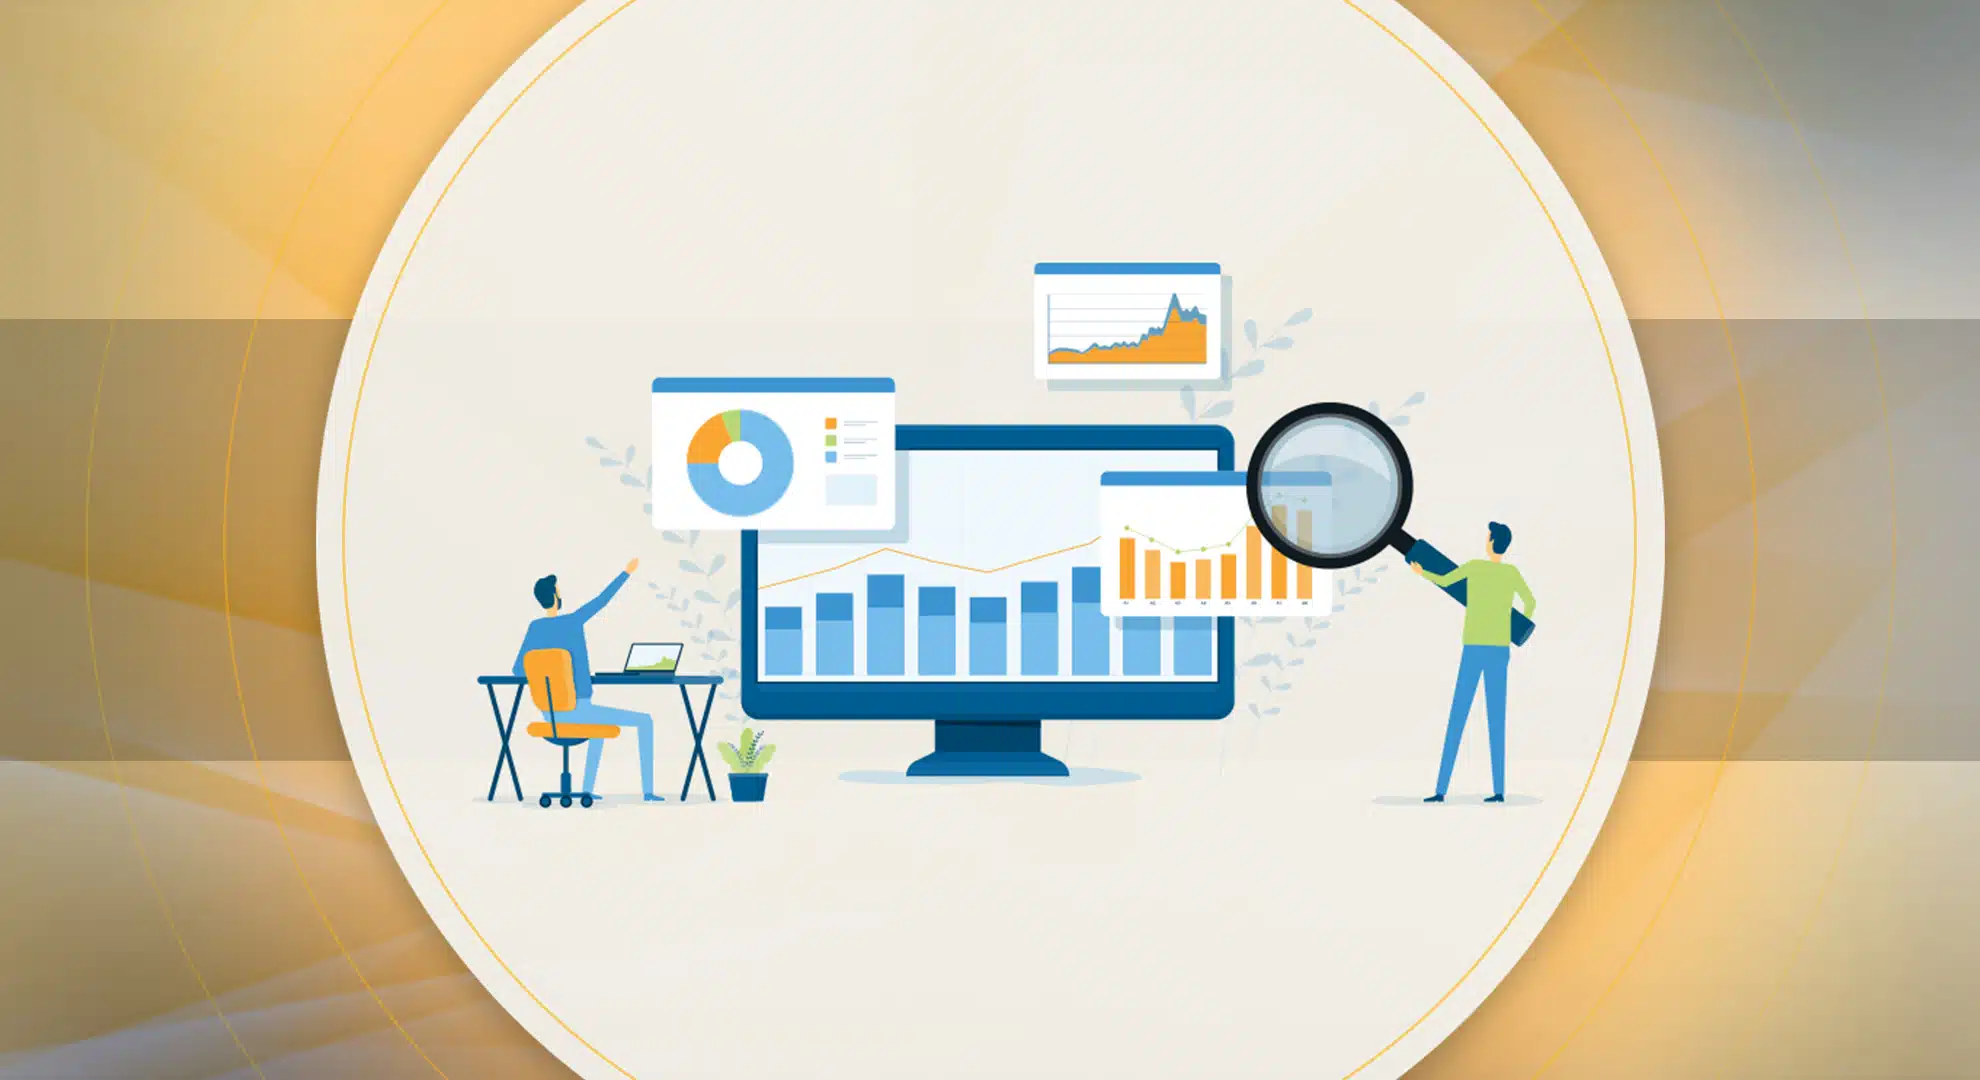
Business analytics dashboards are one of the business intelligence tools used by businesses to visualize the data being collected. A business analytics dashboard aims to show the business owner how their company is doing and what they need to do to improve.
The features of a business analytics dashboard include the following:
- Data visualizations show how many customers have been acquired and lost in different periods or how much revenue has increased or decreased over time.
- Interactive charts, graphs, and tables allow users to drill down into specific areas of interest.
- A chronological timeline shows when certain events occurred to determine correlation or subsequent outcomes (such as increases or decreases in sales).
Want to know the types of business analyst roles? Check out our blog on business analyst types for more information.
- Marketing Analytics
Marketing Analytics uses statistical analysis to understand and improve marketing campaigns. It can be used for market segmentation, branding, pricing and promotion strategies, and customer acquisition.
Marketing analytics consists of four main areas:
- Market Segmentation
- Market Forecasting
- Demand Generation
- Customer Relationship Management (CRM)
- Digital and Web Analytics
Digital and Web Analytics is a method of tracking user behavior on a website and using that information to improve the user experience.
Web analytics tools are used by businesses to measure the performance of their websites, including how many people visit them, what they do there, and what they click on. These tools allow you to analyze how users interact with your site, which can help you to improve your site’s layout and functionality.
For these tools to work properly, you must first decide on an appropriate set of variables that will be tracked by your tool. These variables can include the following things:
- User actions (whether or not someone clicked on something)
- Pages viewed (this can be broken down into individual pages)
- Links clicked (this can be broken down into individual pages)
Want to know the essential tools used in business analytics? Check out our detailed guide on business analytics tools for more information.
- Financial Analytics
Financial analytics is applying data and other information to evaluate and make decisions in a financial context. It can help companies improve their decision-making, understand market trends, manage risk, collect revenue, manage costs, and optimize operations. This type of analysis is often used by banks, hedge funds, and insurance companies to evaluate their investment opportunities and by governments and public organizations like the CIA or FBI. Know more about financial analysts.
Business Analytics jobs and salaries
| Jobs | Salaries offered |
|---|---|
| Data Scientist | INR 10 LPA |
| Business Analyst | INR 8.8 LPA |
| Business Intelligence Analyst | INR 7 LPA |
| Data Analyst | INR 12 LPA |
| Business Intelligence Specialist | INR 13.1 LPA |
| Data Analytics Manager | INR 22 LPA |
Conclusion
Online Business Analytics programs from Manipal Academy of Higher Education (MAHE) are the best way to get a quality education and make your career in the field of business analytics.
MAHE is a global leader in providing education with cutting-edge technology and a strong focus on business. The online M.Sc. in Business Analytics program and PGCP in Business Analytics offered through Online Manipal are designed by industry experts and provide training in areas such as Data Science, Big Data Analytics, Machine Learning, Predictive Analytics, etc. The syllabus is practical and relevant to real-life problems organizations across industries face.
Key takeaways:
- Business analytics is understanding and managing data to improve business performance.
- Business analytics is a key component of any company’s management system and can be used to predict customer behavior, evaluate marketing campaigns, and measure the effectiveness of financial strategies.
- Analyzing data allows businesses to make more informed decisions about their products and services, leading to improved sales, higher profits, and reduced costs.
Become future-ready with our online M.Sc. in Business Analytics program


