Listen to this blog
Key takeaways:
- Data analytics in business help in the decision-making process
- Various sectors, including finance, media, sports, healthcare, and consumer trade, among others, have adopted the data analysis
- Marketing costs can be reduced through efficient data analytics
- Data visualization tools like Infogram, Wrapper, and Google Chart help in transforming the data into visual format
Based on data analysis, insights assist you in gaining a clear understanding of your business and taking measures to enhance it accordingly. Businesses use data analytics to govern businesses and minimize losses in the organization. This article aims to give readers an idea of how to derive insights from data. Let’s take an example to see the importance of statistics in business. For instance, a data insight could be data supporting that consumers generally make an account within five minutes of browsing a website.
How do data analytics help businesses?
Data analytics help businesses across sectors to make informed and sound decisions. You can see the importance of data analytics through the impact of data analytics on the following sectors:
Finance
Banking and securities use data analytics in supervising stock markets by setting up network activity monitors. Natural language processors (NLP) keep a tab on transactions to spot fraudulent transactions. Data analysis in exchange commissions eliminates illegal training by monitoring the financial market.
Media
Communications and media incorporate data analysis to offer authentic and live reportage of events worldwide on multiple platforms like the web, TV, and mobile. For example, as a media segment, the music industry uses data analytics to keep a record of trends. Autotuning software shows the importance of business statistics by eventually picking up on these and generating catchy music.
Sports
The sports industry adapts data analytics to detect and comprehend viewership patterns concerning varying global events. Also, the performance of players can be tracked using data analysis. The rising importance of data analytics can be seen in major sports events like the FIFA world cup and Wimbledon.
Medical
Healthcare uses data analytics to stockpile public health data for accurate and quick solutions to health problems on an individual level. Determining the global outreach of virus strains like COVID-19 also becomes easier. The respective health ministers worldwide realize the importance of data analytics, executing appropriate data usage after collecting census and conducting health surveys.
Education
The education industry incorporates data analytics to upgrade pre-determined literature for fields experiencing rapid development. Universities and institutions worldwide use it to monitor and track the performance of students and faculty performance. Moreover, data analytics is important when the education industry uses data analysis to determine students’ interest in different subjects through their attendance.
Manufacturing
Manufacturing companies use data analytics to boost productivity and improve supply chain management. Optimum allocation of resources required for production can be achieved to witness maximum benefits.
Consumer trade
The importance of business statistics in consumer trade is visible in predicting inventory requirements and managing the staffing process. Consumer trading companies use data analytics to grow their trading activities by offering loyalty cards as a medium to keep a check on them.
Insurance
The insurance sector uses data analytics, from creating new policies to operating claims. Insurance companies manage their claims through predictive analytics generated using data analytics. The valued importance of business statistics is clear in tracking schemes of policy. It answers questions like:
- Which policy is high in demand?
- Which policy generates the highest revenue?
Why are data insights important?
With effective strategy, data insights can offer a competitive edge over your contenders. The growing importance of business statistics influences product development, target content, and operations efficiency.
Data analytics allows a better and deeper comprehension of the current market and provides a reliable base to predict futuristic outcomes. This equips business people with valuable insights into consumer demand and launches products and marketing campaigns accordingly. Because the consumers receive what they desire, marketing expenses to talk them into investing are saved.
The importance of data analytics is also observed in streamlining operations to boost benefit levels. You can take quick and measured action against any issues that could come up.
Process of pulling insights from data
Finding valuable data
Your objective will lay out the foundation of your data. Quantitative data includes numeric data, such as sales figures, while qualitative data includes descriptive data, like customer reviews. It would help if you created an effective strategy to collect and aggregate appropriate data. Data management platforms (DMP) are tools that help in collecting relevant data.
Organizing data
The data you’ve collected has to go through a refining phase to be analysis-ready. Get rid of extensive errors, replicates, and outliers to organize your data. Clean up typos and layout issues for the data, to be precise.
Analyzing data
If you have a thoughtful combination of data and business analysis tools, you are already halfway there. Google sheets, Excel and Airtable are some data analysis tools, whereas Tableau and Google Data Studio are business analysis tools. You can ace the next step of pulling insights from data with the right tools.
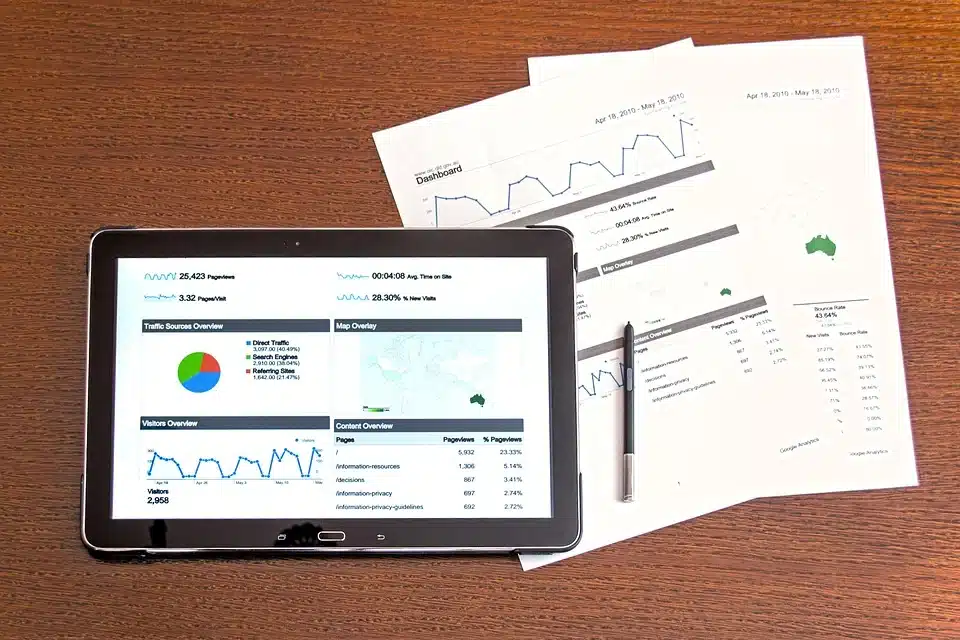
Visualizing data
Visualization of data offers a summary of the data, making it easier for you to track trends, read patterns and identify relationships in the collected data. Think of it as a dashboard that displays the primary aspects of your data. You can use these visualizations to back up your business decisions and present your discoveries to the rest of the team.
Transforming data into useful information
Once you have collected and organized your data, you are ready to follow up with the transformation of this data into useful information. The collected data will have to be combined with other relevant data. Then you can go ahead and access the outliers that require to be fixed.
While doing this, remember to apply your experience and knowledge specific to your business to transform it into information that assists decision-making.
Tips for gleaning insights from data
- Visualize data on a platform: Data visualization platforms help transform concise yet relevant data into visual formats like graphs, heat maps, or charts. Tools like Wrapper, Infogram, Google Chart, and Tableau, among others, enable business people to make data-driven decisions. Data visualization tools for data analytics take the burden off your shoulders of manually sifting through mass information.
- Identify the correct patterns in data sets: Timely recognition of accurate patterns in data sets permits business people to predict outcomes. Patterns can be classified into spread, shape, center, and unusual features. This is helpful in data analysis as probability helps to anticipate the patterns in your refined data.
- Look at the right time frames: You may face challenges if you are viewing your data in isolation. The missing piece here is the context of how the current data fit compared to the past time frames. Drawing comparisons between the current data and previous performance works until you are looking at an entirely new product feature. In this case, bringing in industry benchmarks would be more helpful.
- Measure absolute numbers, not average or totals: If you want accuracy in your business statistics, there are better ways to go about it than deriving the average or adding up the values. Using absolute numbers in data analysis will provide you with more precise visuals and insights that enhance your understanding of the situation in a reliable way.
Conclusion
If you are curious about Business Analytics and how it works, you’re at the right place. Online Manipal is here to feed your curiosity with quality courses highlighting the importance of business statistics. Our subject matter experts at Online Manipal deliver 100 percent online courses like Masters in Business Analytics and PCGP in Business Analytics.
Get in touch with our admission counselor to kickstart your education today.
Become future-ready with our online M.Sc. in Business Analytics program