
Listen to this blog
Recently I received a dump of data from a friend of mine who has an online store. As a data science enthusiast, I wanted to check for simple and common use cases. I wanted to understand
- What kind of predictive analysis can be done?
- Is there a possibility of applying clustering analysis techniques?
I decided to begin with simple predictive and clustering techniques. This blog is a walk-through of my learning and observations.
Prep work and Analysis
Be it Predictive Analysis or Clustered Analysis, the first step is to wrangle the data or clean it. The data I received consists of products, customers, sales, inventory, and wastage. There were a good number of customers, unfortunately, recorded with different names many a time, or a salesperson typing her own name (instead of the customer), the date column missing, capital / small letters being used interchangeably, and so on. The first few days went into reconciling the data. Then we wrote a script that can create a pipeline to handle multiple scenarios and then deposit cleaned data into a new repository.
Another important step for Predictive Analysis or Clustered Analysis is exploration. How much data is available? What is the distribution across categories? How many customers? etc. We identify some statistical information like – What does the average spend per customer? What does the average spend per item? What does the average spend per category of products? Is there a deviation in the sales across months, customers, etc.? What are the statistical values like mean, deviation, quantiles, etc? Calculate and append them to the existing data. Now, the data is ready for the next step.
Predictive Analysis
There are several predictive algorithms starting from simple logistic and linear regression algorithms all the way to the transformer-based algorithms to predict the next word or sentence. It could also be to predict the presence of cancerous tissue in an MRI image.
Given the type of dataset, our use-case was to predict if a particular customer will buy or not buy a particular product. These types of Predictive Analytics are referred to as ‘Recommendations’.
Typically, we use techniques like the Apriori algorithm and basic collaborative filtering. The count of the sales in some categories was disproportionately higher than that of other categories. So, these techniques performed poorly.
Singular Value Decomposition (SVD) is another method to predict the probability of purchase. This is a popular technique used in movie or product recommendations. However, in this case, there were no ratings. So, to compensate, we calculated the number of times the product was purchased by the person out of all his visits and converted it to a rating of 1 to 5.
The algorithm was able to predict a value of 1 to 5 for each product. 5 implies a definite purchase and 1 implies that the chances are low. We calculate the algorithm on the n-1 purchases of data and then predicted the probability for the nth purchase. If we set 3 as the threshold, the algorithm was able to predict with an accuracy of 60-70%. This was just a simple prediction and not tuned or optimized.
Learn more about the role of predictive analysis in business analytics.
Cluster Analysis
I then decided to apply a few clustering analysis algorithms to the dataset. The simple and the most popular one is the K-Means method. In this, each point becomes part of a single cluster. The cluster of the point is decided such that the sum of the square distance from the point to the cluster’s centroid is at the minimum. The centroid is adjusted after each iteration and the process is repeated until the stopping condition is met.
In our dataset, a mere count of the purchases or quantity of each product did not yield good results. However, once we started to add the statistical data, for example, the mean, median, deviation, and quantiles for each product and customer – there were some interesting clusters that began to evolve.
Once we clustered the data, we calculated the cluster value for each row. We visualized them using simple plots. Figure 1.1 is a mapping of the Average Cost spent by the customer to the average days between two purchases. We used the cluster value as the ‘hue’.
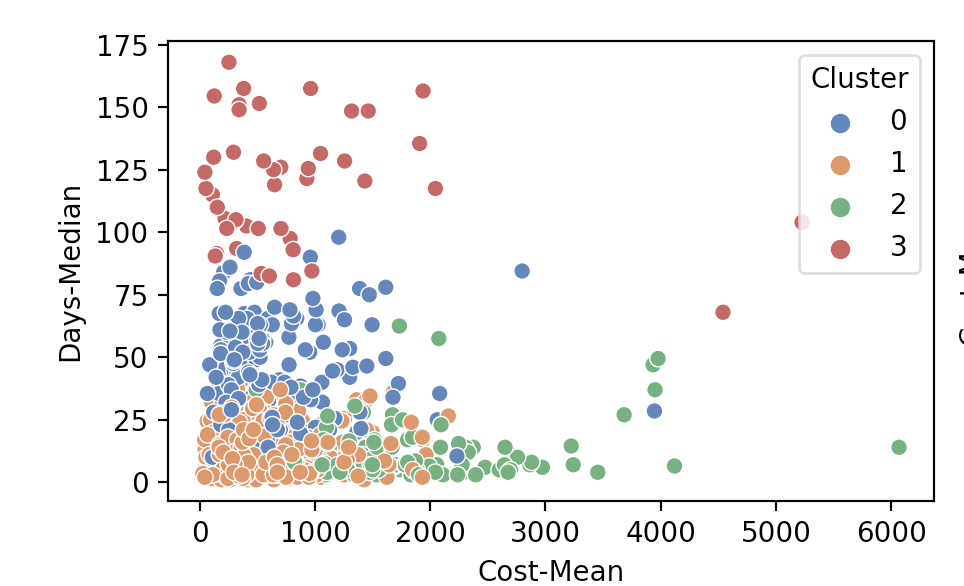
From the above image, we can infer that – there are many customers who spent an average of fewer than INR 1000 for every purchase. However, they were consistent and came frequently – (once every two weeks). There were a small set of people who are high-value and frequent (very important customers). There were a few customers who are not very frequent and of course, there was a set of non-returning customers.
Figure 1.2 is another plot of the ‘Category of Purchase’ to ‘Average Spend’ by the customer. Again, we use the cluster value as the ‘hue’.
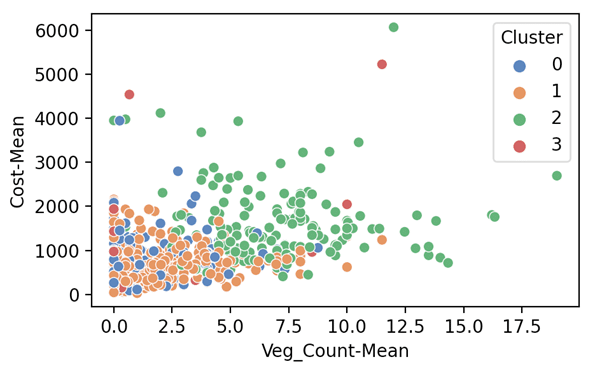
Interestingly, the high valued customers are more interested in vegetables than other categories of products.
Clustering helped us to ask ourselves some very interesting questions
- There are a few customers who were frequent but not high valued. Can we get them to try products in other categories?
- There were a few customers who were not frequent. Is there a way they can be made more frequent? Are there any difficulties for them to access the store or the app?
Conclusion
Technology giants like Amazon use Transformer Bases Agorithms, as well as Bandit Algorithms (reinforcement learning), causal reference, etc to make better predictions. They extensively use clustering techniques to find interesting insights. Very often to improve the effectiveness of the predictive algorithms.
(The purpose of this blog is to give readers a real-world application of predictive and clustering analysis. It tries to demonstrate how even simple and basic predictive and clustering techniques can generate some interesting insights.)
References:
Prepare for your next career milestone with us