
Listen to this blog
Data analytics is extracting data from raw sources and then processing it to generate meaningful insights. It is an important part of most businesses, as it helps them make informed decisions that can improve their processes and increase profits.
The use of tools for data analytics has grown exponentially over the years, with many companies now using it to gain a competitive advantage over their rivals. The challenge today is finding the right tools used for data analysis to help you get started with this process.
But let us first try to understand what data analytics is.
What is data analytics?
Data analytics is the process of collecting, analysing and interpreting data in order to make better business decisions. It allows customers to gain useful insights about their customers through various sources such as customer surveys, social media posts, website visits, etc.Today, it is used in almost every industry from retail to manufacturing to healthcare.
What are data analytics tools?
Data analytics tools are software that helps you to collect, store, and analyse data. They can be used to create visualisations, build predictive models, and perform statistical tests.
These tools are often used by businesses to gain insights into their customers and operations. For example, a company might want to know how many customers they have at different times of the day. They could use an analytics tool like Google Analytics or Kissmetrics to track this information over time.
Why do you need them?
The rise of big data has led to the development of data analytics tools that help businesses process large amounts of data in order to make informed decisions.
A good data analytics tool helps you get from raw data to useful insights quickly and easily. It should make your job easier by automating tasks that might otherwise be complex. It also helps you understand how your customers are interacting with your business so that you can improve their experience with your product or service.
To help you, here are the top 10 data analytics tools list in 2022:
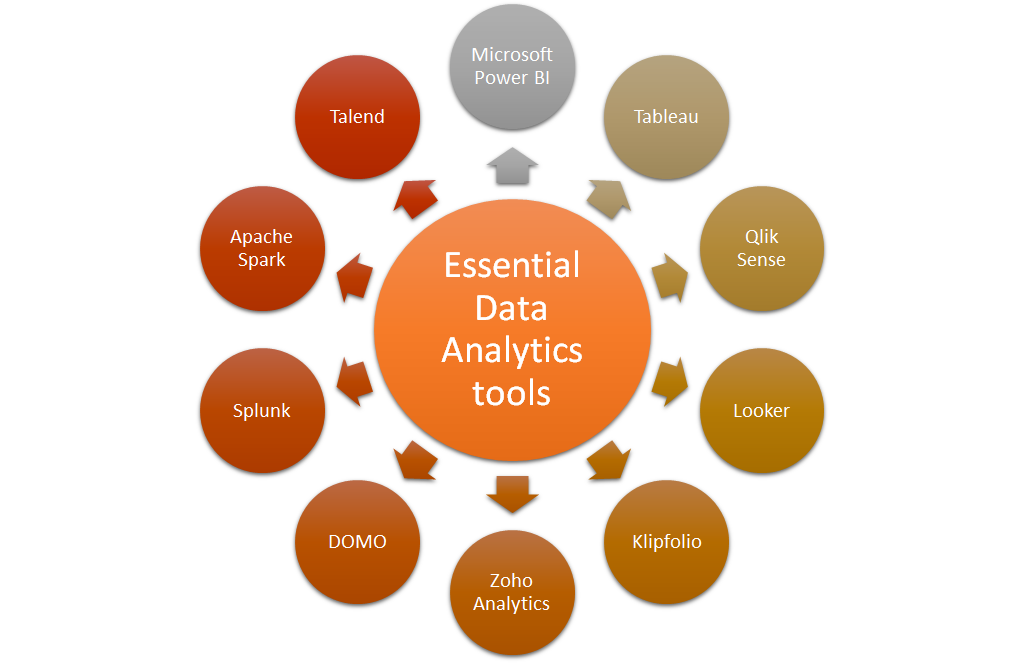
- Microsoft Power BI
Microsoft Power BI is a software product that helps you visualise your data and make it more accessible. The software is used in various industries, including education, healthcare, finance, and retail. If you are looking to improve your business performance, then Microsoft Power BI can help you make data easier to analyse and understand. It is one of the best analytics tools in the market.
The following are some of the benefits of using this tool:
- It is easy to use: Power BI has an intuitive interface that makes it easy for anyone to use. It also works with various devices and browsers, so you don’t have to worry about compatibility issues when using this tool for business purposes.
- It is compatible with other tools: You don’t have to worry about having multiple tools for different tasks because Power BI integrates seamlessly with other tools such as Excel or SQL Server, so all your information is stored in one place instead of several different locations which can be confusing if you are trying to find something quickly.
- It offers real-time insights: With this tool, you’ll have access to real-time insights, so no matter what time zone someone lives in—Japan or New Zealand—you’ll still be able to get up-to-date information on demand without having any delays.
- Tableau
Tableau is a data analytics tool companies use to extract insights from their data and make better business decisions. It is a cloud-based software with various features such as visualisation, reporting, analytics and collaboration, making it easy for users to quickly analyse large amounts of data.
Tableau is used by many organisations across the globe to improve their business processes by making better decisions based on data analysis. Some of its key features include:
- Visualisation: You can easily view data from different perspectives or filter specific items according to criteria set by yourself or others to get accurate results quickly. You can create interactive dashboards that allow others to see what you see. This will save time and money since there will be no need for additional research or data collection efforts by other parties involved in making decisions based on information provided by you (or someone else).
- Reporting: Tableau provides users with several options regarding reporting, such as printable PDF reports, emailing reports directly from within the application itself, etc. This feature enables users to share their findings easily with others who may not be able to access these files directly from their own computers (either due to a lack of technical knowledge or simply because they are unable to install software onto their system/device).
- Qlik Sense
Qlik Sense is a platform that enables users to create, share and analyse data. It can be used to display data in various charts, tables and graphs. Qlik Sense is also compatible with other software such as Microsoft Office, Salesforce and SAP.
Qlik Sense is useful for companies that need to analyse their data to make better business decisions. The platform provides an easy way for users to explore their data by creating interactive visualisations that let them see relationships between different types of information clearly.
Qlik Sense offers many advantages over other similar platforms:
- It is easy to use: Qlik Sense’s user interface is simple, intuitive and customisable, making it easy for anyone to learn the basics and start working with the tool immediately.
- It is affordable: Qlik Sense’s pricing model is based on the number of concurrent users, so if you need more than one person analysing data at once, there will be no additional cost for each additional user.
- Looker
Looker is a data analytics tool that helps you visualise and analyse your data simply and interactively. It allows you to connect to any database and gives you the ability to create powerful reports, pivot tables, dashboards, and more.
Looker allows users to create reports that can be shared with others in their organisation. This makes it easier for everyone to collaborate on projects. With Looker, users can share their work with other team members and set up alerts to know when new information has been entered into their database.
Looker also offers extensive API support so companies can integrate their data into third-party apps such as Gmail, Google Sheets, Microsoft Office 365, and Salesforce. This makes it easy for teams to share information across different platforms without worrying about compatibility issues or data duplication errors caused by manual data entry errors.
- Klipfolio
Klipfolio is a cloud-based data analytics tool that allows users to create and share custom data visualisations. With Klipfolio, you can easily create dashboards and graphs specific to your needs—and then share them with clients, colleagues, or others who need to see the data.
There are several advantages to using Klipfolio:
- It is easy to use: Once you’ve created a dashboard or graph, sharing it is as simple as sending an email or posting on social media. The recipient gets an email with a link that shows them the dashboard right in their browser window—no software download required!
- It is fast: You can spend more time analysing your data than setting up your dashboard or graph because Klipfolio makes it easy to start! Plus, sharing links takes seconds—there’s no need for downloading files or installing anything.
- It is customisable: If you are looking for something more advanced than basic charts and graphs, Klipfolios lets you create interactive dashboards with filters and custom fields so you can filter or search for specific information without having any hindrances.
Getting the habit of being a professional data analyst can be hard. Want to make it easy? Visit the Online Manipal course for more information.
- Zoho Analytics
Zoho Analytics is a comprehensive and easy-to-use business intelligence software tool. Zoho Analytics is used by companies of all sizes, including small, mid-market, and large enterprises.
Zoho Analytics features include:
- Dashboard builder: Easily create dashboards with drag-and-drop widgets and themes.
- Data visualisations: Choose from over 100 different chart types.
- Reporting: Create reports in just a few clicks with our intuitive interface.
- Tableau connector: Access data from Tableau Online or Tableau Server without leaving Zoho Analytics.
- DOMO
DOMO is a tool of data analysis that helps users build a business intelligence dashboard. The software offers over 200 pre-built widgets and connectors and the ability to create custom dashboards.
The dashboard builder allows users to drag and drop widgets onto a canvas to build their own customised dashboards. These widgets are organised by category, including reports, charts, maps, alerts, etc. Once added to the canvas, users can connect their widgets together using DOMO’s drag-and-drop functionality.
Users can access all their data from one place using DOMO’s data warehouse technology. The platform offers access to over 100 data sources, including Google Analytics, Salesforce CRM, Salesforce Data Cloud and AWS Lambda.
It also integrates with many other third-party applications such as QuickBooks Online and Microsoft Power BI so that you can use your existing data without having any duplication issues between systems or having multiple providers that might be hard to manage later on down the road when things start getting complicated for example if you have multiple providers with different pricing models etc.
- Splunk
Splunk is an analytics tool that analyses data and turns it into actionable information. Splunk users can use the tool to monitor, troubleshoot, and gain insight into their business applications and IT infrastructure.
Splunk provides a robust platform for collecting, indexing, searching, and analysing machine-generated data in real time. This platform allows you to search for insights in your data using natural language queries.
The following are some of the benefits of using Splunk:
- Data analysis: Splunk is an excellent tool for performing data analysis in real time. You can use this tool to collect real-time data from different sources and analyse it.
- Search engine: Splunk is also one of the best search engines available today. It offers you a very powerful search engine that helps in finding relevant information out of millions of records within seconds.
- Security scanning: Using Splunk’s security scanning feature, you can easily scan your network for potential vulnerabilities or intrusions in real time and take necessary actions accordingly.
- Apache Spark
Apache Spark is a tool for data analysis. When people talk about Apache Spark, they usually mean the Apache Spark Core project. The core project contains the Scala and Java APIs for building programmes that run on a cluster of nodes and manipulate data in parallel using in-memory storage.
This post discusses the benefits of using Apache Spark for data analysis.
Benefits of using Apache Spark for data analysis
- Speed: Spark is fast because it allows many tasks to be performed in parallel. It also allows you to run at scale by distributing across multiple machines in a cluster.
- Scalability: The ability to take advantage of clusters of machines on demand allows you to scale up or down as needed, which means your workload can grow with your business needs instead of becoming a bottleneck.
- Cost: An open-source solution like Spark eliminates the need for expensive software licences and maintenance contracts, which saves time and money over time while increasing agility and flexibility overall!
- Talend
Talend is a data integration tool that provides access to data from all over the place, including databases, files and APIs. It allows you to integrate these disparate sources and use them as one cohesive source of information—and what’s more, it is extremely easy to use.
One of Talend’s most useful features is its ability to connect with multiple databases at once, which means you don’t have to worry about having different people working on different parts of your data analysis. This saves time and makes it easier for everyone involved in the process to stay up-to-date on what’s going on.
Final thoughts
Analytics is a critical aspect of digital marketing; as such, it is only expected to become more important in the coming years. Make sure you invest in the best data analytics tools for your business. Using the right skills will help you gain a competitive advantage and increase your revenue. There are various analytics tools and platforms that you can use to get actionable insights from your website or app.
Want to become an expert in the data analysis domain? Enrol with Online Manipal Courses to make it possible.
Key takeaways:
- Managers and other stakeholders use tools for data analysis to identify business problems and create business strategies.
- These tools make it possible to identify the customers most likely to use a service, what they think about services provided by an organisation and the dislikes of current and potential clientele, find new markets and opportunities, make forecasts on how revenue will be affected by future events, measure profits and costs.
- Data analytics tools increase accessibility and open up new creative possibilities.
Become future-ready with our online M.Sc. in Data Science program